
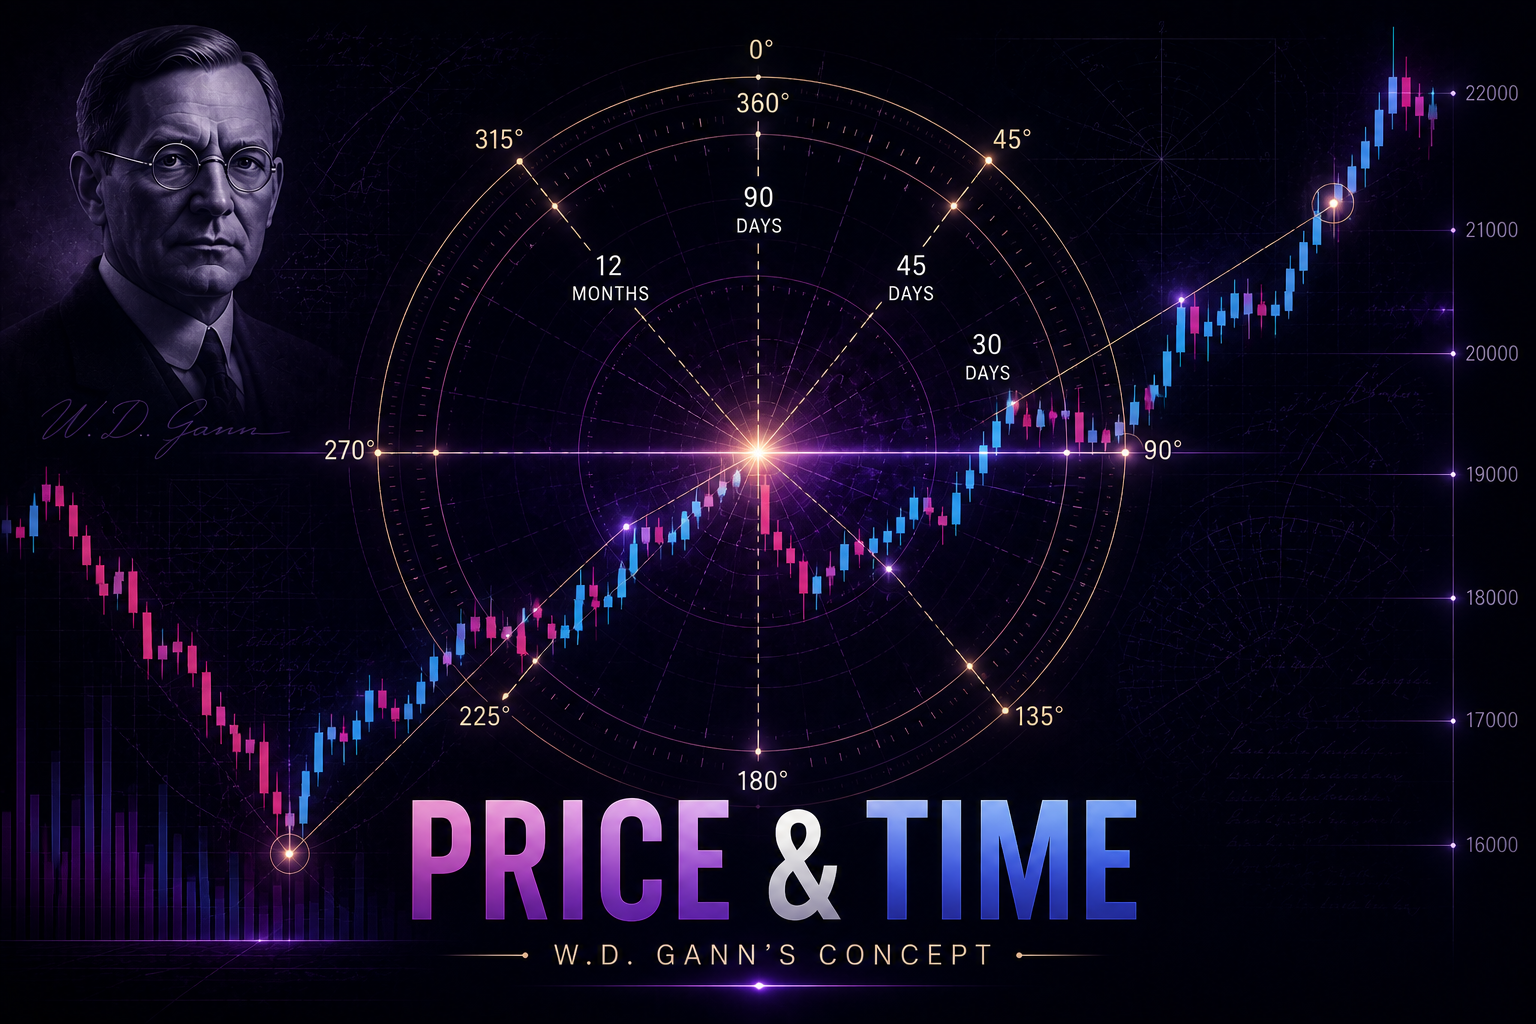
Price & Time in W.D. Gann Theory: Understanding the Relationship Between Market Movement and Time
Most traders analyse the market by focusing primarily on price: support, resistance, highs, lows and price targets.
W.D. Gann introduced another important dimension to market analysis: Time.
His approach was based on the idea that understanding where price may react is only one part of market analysis. Traders can also study when an important market phase or potential turning period may occur.
This relationship between Price and Time became one of the central ideas associated with Gann analysis.
What Does Price & Time Mean in Gann Theory?
In simple terms:
Price tells us WHERE the market is.
Time tells us WHEN an important market period may occur.
Traditional technical analysis often focuses heavily on price levels. Gann analysis attempts to study price movement together with the passage of time.
When an important price area and an important time period occur together, traders may pay closer attention to the market.
Why Is Time Important in Market Analysis?
Markets continuously move through periods of expansion, consolidation, correction, reversal, and expansion.
These phases do not depend only on price. They also develop over time.
This is why Gann traders often measure the distance between important market highs and lows in both price and time.
The objective is not simply to predict a particular date. Instead, time analysis can be used to identify periods where traders may watch market behaviour more carefully.
Understanding Gann Time Cycles
A time cycle measures the number of trading days, calendar days, weeks or months between significant market events.
For example, suppose an important market low forms. A trader studying time cycles might begin counting forward:
- 30 days
- 45 days
- 90 days
- 180 days
- 360 days
- 12 months
These periods can then be monitored for changes in market behaviour.
The important point is that reaching a cycle does not automatically mean the market will reverse. It simply creates a potential time window of interest.
Understanding Gann Degrees
Gann analysis frequently represents market cycles using a 360-degree framework.
Think of one complete circle as 360 degrees.
Important divisions can include:
45 degrees -> 90 degrees -> 135 degrees -> 180 degrees -> 225 degrees -> 270 degrees -> 315 degrees -> 360 degrees
These divisions allow traders to study relationships between different portions of a complete cycle.
What Is Price-Time Confluence?
One of the most useful ways to understand Gann analysis is through the idea of confluence.
Suppose the market approaches an important historical resistance level. At approximately the same period, a significant time cycle calculated from an earlier major low is also completing.
Important Price Level + Important Time Window
This can create an area of increased analytical interest. Instead of immediately assuming a reversal, traders can observe whether the market begins showing actual confirmation through price action.
Price and Time Should Not Be Studied Separately
Imagine price reaching an important resistance level, but the market continues showing strong bullish momentum. The price level alone may not be enough to indicate a reversal.
Similarly, reaching a 90-day or 180-day cycle does not automatically mean that a top or bottom must form.
A more structured approach is to combine:
Price Structure + Time Cycle + Market Reaction
How Can Traders Study Price & Time?
A basic Price & Time analysis can begin with identifying an important swing high or swing low.
- Step 1: Mark the major market turning point.
- Step 2: Observe the price distance travelled from that point.
- Step 3: Measure the time elapsed in days, weeks or months.
- Step 4: Identify important Gann time divisions or cycle periods.
- Step 5: Look for major support, resistance or structural price areas.
- Step 6: Observe the actual market reaction when price and time factors begin to align.
Price & Time Balance
Another concept associated with Gann analysis is the idea of balance between price and time.
Market movements can be studied through two dimensions:
Vertical movement = Price
Horizontal movement = Time
Gann-style chart analysis attempts to understand how these two dimensions interact.
Common Mistakes When Using Price & Time
One common mistake is assuming that a specific cycle guarantees a market reversal. A time cycle should generally be treated as a potential timing window, not a guaranteed prediction.
Another mistake is forcing cycles onto every market movement. Traders should first identify meaningful swing highs and lows before measuring time relationships.
Most importantly, Price & Time analysis should be combined with proper market structure and risk management.
Final Thoughts
W.D. Gann's Price & Time concept provides a different way of looking at financial markets.
Instead of analysing only "At what price could the market react?", Gann analysis introduces another question: "At what time could an important market phase develop?"
PRICE -> Where to watch
TIME -> When to watch
MARKET REACTION -> What to do
The goal is not to predict every top or bottom perfectly. It is to identify areas where price structure and timing factors come together, and then observe how the market actually responds.
Disclaimer: This content is for educational purposes only and does not constitute financial or investment advice. Gann techniques, time cycles and price analysis cannot guarantee future market movements.