
What Is Institutional Activity in Trading? Understanding Big Player Zones & Price Reactions
Financial markets are influenced by many different participants. Retail traders may place relatively small orders, while banks, funds, institutions, and other large market participants can operate with significantly larger positions.
Because of this difference in order size, certain areas on a price chart may show unusually strong buying or selling activity.
Traders often study these areas to understand where significant market participation may have occurred and how price reacts when it returns to those levels.
What Is Institutional Activity?
Institutional activity refers to market participation from large financial entities such as:
- Banks
- Hedge funds
- Investment funds
- Asset managers
- Other large market participants
Unlike a typical retail order, large positions may require substantial liquidity to enter or exit efficiently.
As a result, institutions may build or reduce positions around particular price areas rather than executing everything at a single exact price. These areas can sometimes become important zones on a chart.
What Are Big Player Zones?
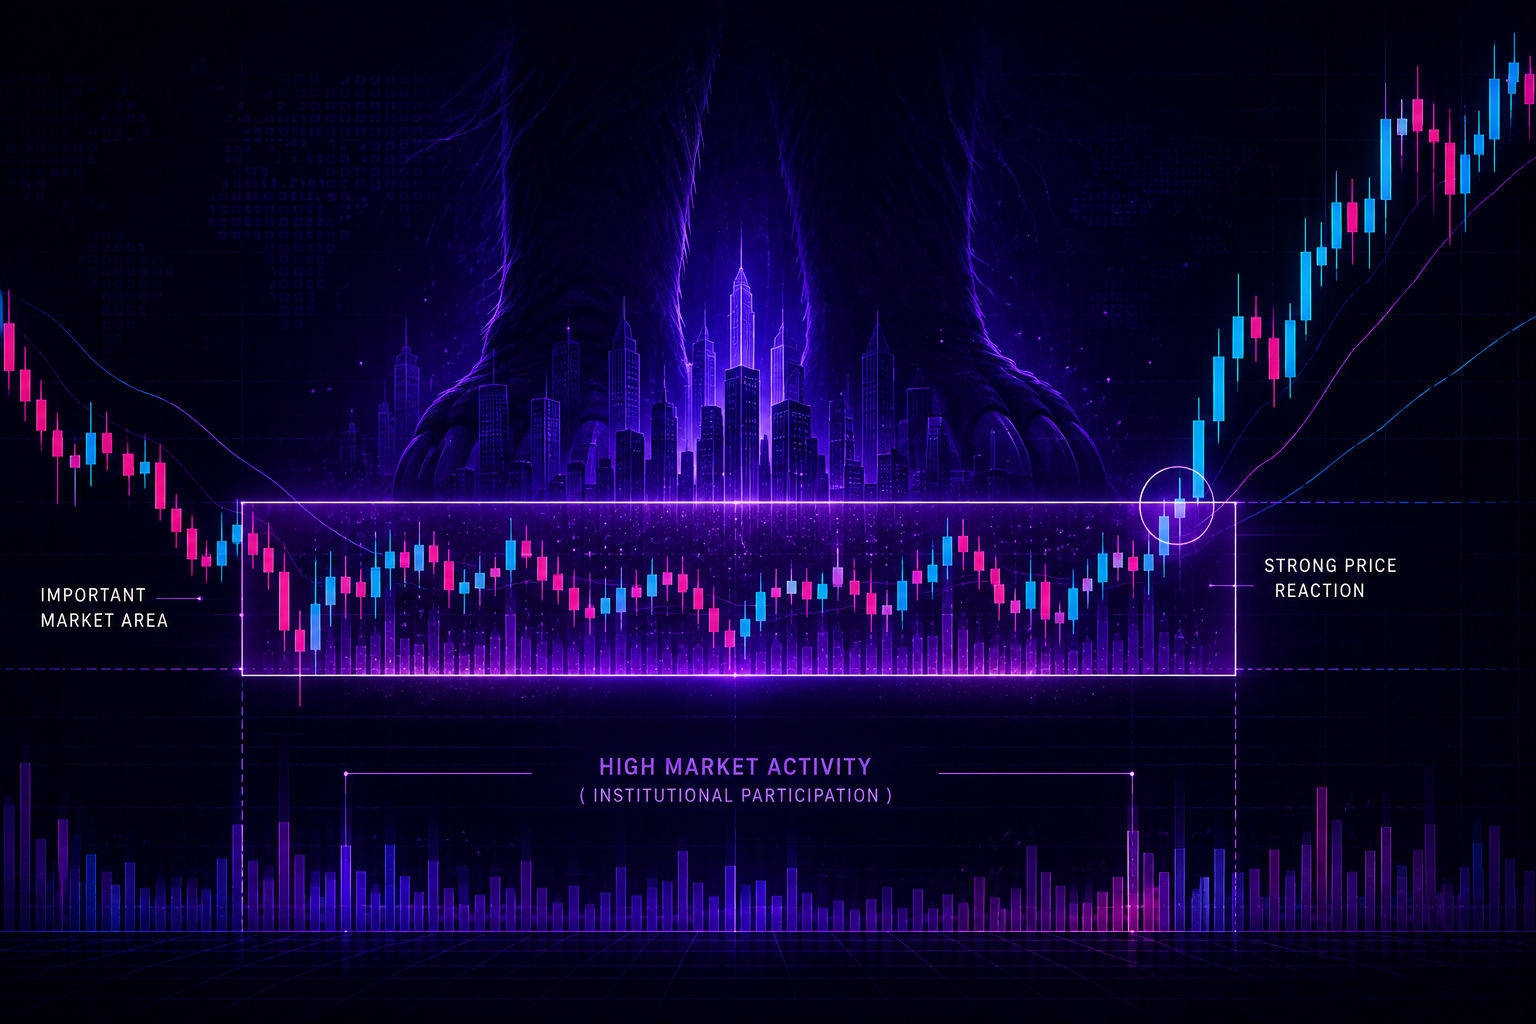
A Big Player Zone is a price area where traders believe significant buying or selling activity may have taken place.
Instead of treating support or resistance as one exact horizontal line, traders can study it as a zone or range.
For example, price may spend time consolidating inside a range before suddenly making a strong directional move. That consolidation area can become interesting because it may represent a period where buyers and sellers were actively competing before one side gained control.
How Can You Identify Potential Institutional Activity?
There is no single indicator that can confirm institutional participation with certainty. Instead, traders usually look for a combination of price and volume behaviour.
1. Consolidation Before a Strong Move
Price may remain inside a relatively narrow range before suddenly breaking out. The stronger the movement away from the range, the more attention traders may give to the original area.
2. Increase in Market Activity
Volume can provide additional information about participation. If trading activity increases significantly around an important price area, it may indicate stronger market interest. However, volume should not be used alone to make a trading decision.
3. Strong Price Expansion
After leaving an important zone, price may move rapidly with larger candles and relatively small pullbacks. This shows a temporary imbalance between buying and selling pressure.
4. Previous Price Reactions
If price has reacted multiple times around a similar area, that zone may become structurally important. The reaction itself is often more useful than simply drawing a random support or resistance line.
Why Does Price Sometimes Return to These Zones?
Markets rarely move in a perfectly straight line. After a strong move, price may retrace toward the area where the movement originally started.
When price returns, three broad scenarios are possible:
- Reaction: Price touches the zone and moves away strongly.
- Consolidation: Price stays around the area while buyers and sellers compete.
- Breakdown or Breakout: Price moves through the zone, suggesting the previous market structure may no longer be valid.
This is an important point: a zone is an area of interest, not a guaranteed reversal point.
Strong Price Reaction: What Does It Mean?
A strong price reaction occurs when price reaches an important area and quickly moves away from it.
For example, imagine that price consolidates for several hours and then breaks upward aggressively. Later, price returns near the original breakout area.
If buyers become active again and price moves upward with momentum, traders may consider that a meaningful reaction. However, the quality of the reaction should be studied together with market structure rather than in isolation.
Market Structure Matters
One of the biggest mistakes beginners make is identifying a zone without considering the overall market structure.
Before evaluating a potential Big Player Zone, consider:
- Trend: Is the market trending upward, downward, or moving sideways?
- Swing Structure: Are higher highs and higher lows forming, or lower highs and lower lows?
- Location: Is the zone near an important previous high, low, support, or resistance area?
- Momentum: Did price leave the zone aggressively or gradually?
- Reaction: What actually happens when price returns?
A zone becomes more meaningful when multiple pieces of market information support the same idea.
Volume and Institutional Participation
Volume represents trading activity during a particular period. Higher-than-normal volume may indicate increased participation, but it does not automatically mean institutions are buying or selling.
Volume tells us that activity has increased. Price action and market structure help us understand how the market responded to that activity.
Zone vs Exact Price Level
Markets do not always respect one exact price. Thinking in terms of zones can provide a more realistic representation of how markets move.
This is especially useful when analysing areas of consolidation and high market activity.
Common Mistakes Traders Make
One common mistake is marking too many zones. If almost every area of the chart becomes a zone, the analysis loses its usefulness.
Another mistake is entering immediately when price touches a marked area. A better approach is to observe what price actually does after reaching the zone.
Traders should also avoid assuming that every high-volume area represents institutional buying or selling. Market activity can increase for many different reasons.
Combining Zones With Risk Management
Even a well-defined market area can fail. That is why risk management remains an essential part of trading analysis.
Before considering a trade, a trader should understand where the setup becomes invalid, how much capital is being risked, whether the potential reward justifies the risk, and whether the trade follows a predefined trading plan.
Final Thoughts
Institutional activity and Big Player Zones can provide another way of understanding market behaviour.
Instead of looking only at individual candles, traders can study where significant activity occurred, how price moved away from that area, and what happens when price returns.
Important Zone -> Increased Market Activity -> Price Expansion -> Retest -> Observe the Reaction
When combined with market structure, volume analysis, price action, and proper risk management, this framework can help traders read charts in a more organised and disciplined way.
Disclaimer: This content is for educational purposes only and should not be considered financial or investment advice. Trading involves risk, and no market zone or analytical method guarantees future price movements.